
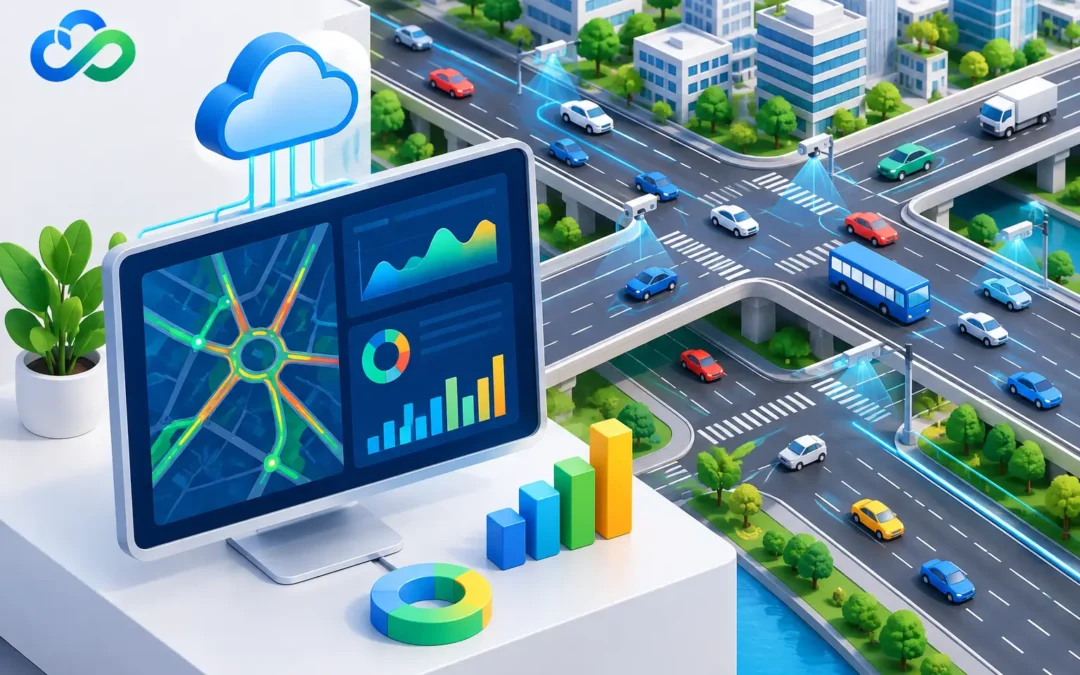
A signal-controlled junction can appear to be operating normally while regularly missing cyclists, extending an unnecessary green stage, or releasing a queue too late. The controller can only act on what it detects. Traffic data analytics converts detection events into evidence that engineers can use to correct these problems, prioritise investment and measure whether a change has genuinely improved the network.
For highways authorities and transport teams, the value is not a larger spreadsheet of vehicle counts. It is a clear understanding of how a location performs by time of day, mode, direction and movement – and the ability to take proportionate action without relying on disruptive roadworks or assumptions.
What traffic data analytics should answer
Useful analytics begins with an operational question. Is congestion being caused by insufficient capacity, poor signal timing, unreliable detection, a nearby school peak, loading activity, or a recurring incident? A count alone rarely settles the issue.
Well-designed traffic data analytics should show demand, behaviour and network response together. Demand includes traffic volumes, directional splits, turning movements, vehicle classes and active travel movements. Behaviour may include approach speeds, headways, queue formation and compliance with speed limits. Network response concerns the outcome: delay, queues, stage demand, green utilisation and, where the available data supports it, journey time reliability.
This distinction matters at junctions. A high traffic flow does not automatically justify a longer green period. If the approach clears quickly and demand is intermittent, adding green time may simply transfer delay to another arm. Conversely, a lightly trafficked side road may produce disproportionate delay if detection is inconsistent or poorly positioned.
The best datasets allow teams to separate these cases. They support decisions based on observed demand rather than historic assumptions, isolated complaints or a single site visit.
Detection quality determines analytics quality
Analytics cannot repair incomplete, inaccurate or poorly classified data. The practical starting point is therefore not the dashboard. It is the detector, its field of view, its placement and its suitability for the road environment.
Above-ground radar, AI-powered video detection and wireless traffic sensors each address different requirements. Radar can provide reliable vehicle detection and speed measurement in demanding weather and lighting conditions. AI video can identify and classify multiple road users and movements where detailed scene understanding is required. Wireless sensors can provide a practical route to collecting volume and occupancy data where civil works must be kept to a minimum.
The appropriate technology depends on the site objective. A rural speed management scheme may need accurate approach speed profiles and vehicle classification. An urban junction may need dependable detection of vehicles, cyclists and pedestrians across several lanes. A temporary traffic management arrangement may place greater value on rapid installation and flexible relocation.
Legacy inductive loops still have a role in some established installations, but they introduce a known constraint: the road surface must be cut, reinstated and revisited when a loop fails. Non-intrusive detection moves much of that work above ground. This can shorten installation programmes, reduce lane closures and avoid repeat carriageway interventions. It also makes it easier to adjust a detection zone as traffic patterns or junction layouts change.
Data quality also needs active assurance. Occlusion, vegetation growth, parked vehicles, poor camera alignment, radar mounting angle and changes to road markings can all affect results. A credible analytics programme includes commissioning checks, periodic validation and a clear record of what each data field represents. Counting every object in view is not the same as measuring the movement that matters to the scheme.
Turning raw data into operational decisions
The strongest use cases follow a repeatable sequence: establish the baseline, identify the issue, intervene, then measure the outcome over comparable periods. This sounds straightforward, but the detail determines whether the conclusion is defensible.
Consider a junction where residents report regular peak-period queues. Traffic counts may confirm demand, but turning movement data can reveal whether the queue is driven by one dominant movement, a short signal stage, downstream blocking or uneven lane use. Speed and queue data can show whether vehicles are arriving in platoons from an upstream signal. Detector logs may expose a separate problem: calls are being missed, so the controller is not responding to actual demand.
The intervention could be a revised detector zone, a change to signal staging, a targeted green extension, a revised offset or a physical improvement. Analytics then makes the result visible. Engineers can compare queue duration, maximum queue length, delay, rejected demand and stage utilisation before and after the change. They can also check that an apparent gain on one approach has not created an unacceptable effect elsewhere.
This approach is particularly valuable where demands vary sharply. School arrival periods, event traffic, seasonal visitor flows and freight activity can create conditions that a daily average conceals. Time-of-day profiles reveal the periods that need action and those where existing operation is satisfactory. That reduces the risk of designing for the peak at the expense of the rest of the day.
Better evidence for safety and active travel
Traffic data has a direct road safety application when it is interpreted in context. Mean speed is useful, but it can hide the upper end of the speed distribution that creates risk for vulnerable road users. Examining percentile speeds, approach behaviour and the timing of pedestrian and cycle movements provides a more complete picture.
At crossings and junctions, AI video analytics can help establish whether cyclists are being detected consistently, whether pedestrians are receiving timely calls, and where conflicts or hesitation occur. It should not be treated as a substitute for engineering judgement or site observation. It is, however, a powerful way to extend observation over days and weeks rather than relying solely on a short manual survey.
Classification is equally important. A lorry, bus, motorcycle, private car and bicycle affect capacity, gap acceptance and safety differently. If the scheme objective is to encourage active travel, data must show whether the solution works for cyclists and pedestrians, not merely whether general traffic throughput has increased.
There is a trade-off here. More detailed data can provide better insight, but it requires clear requirements, appropriate retention practices and careful handling. Authorities should specify the minimum data needed to achieve the operational purpose, especially where video is used. Privacy, data governance and cyber security are engineering requirements, not afterthoughts.
Design the data system around the decision
A common failure is collecting data because a detector can supply it, rather than because a team knows how it will be used. This creates reporting effort without improving operations. Before selecting equipment or a platform, define the decisions that the data must support and the measures that will demonstrate success.
For a congestion scheme, this may mean directional flow, occupancy, queue length and stage utilisation at defined intervals. For speed management, it may mean approach speed distributions, vehicle class and the response to a speed information display. For an active travel route, the requirement may be cycle and pedestrian counts by movement, time and weather condition.
Data should also be available at the right level for each user. Network managers need a concise view of exceptions and emerging trends. Signal engineers need detailed detector and phase information. Scheme sponsors need evidence that links intervention to outcomes such as reduced congestion, safer approaches or fewer unnecessary stops. A vehicle data management platform can bring these layers together, but only when naming conventions, site records and quality checks are consistent.
Interoperability deserves attention at procurement stage. Detection equipment, controllers, communications infrastructure and analytics platforms must exchange meaningful information without creating a closed system that is difficult to maintain. Open, documented interfaces and realistic support arrangements protect the long-term value of the installation.
Measure benefits over the whole life of the asset
Installation speed matters, particularly on busy roads where lane closures carry a high operational and public cost. Yet the most useful measure is whole-life performance. A detector that is quick to deploy but difficult to validate, maintain or integrate will create future workload. Equally, a highly detailed system may be unnecessary where the operational question only requires dependable counts and speed data.
The right balance is determined by site risk, network importance, available communications, maintenance access and the decisions the authority intends to make. C & T Technology supports this practical approach by combining above-ground detection technologies with the technical knowledge needed to apply data at the roadside and across the network.
A road network becomes easier to manage when its data reflects what people actually experience on it. Start with a defined decision, specify detection that can answer it reliably, and keep testing whether the evidence is leading to safer, more efficient operation.