Vehicle Data analytics
A vehicle data anlaytics platform that allows you to easily visualise traffic data from various sensors in the field
ICOMS ROAD TRAFFIC DATA Analytics PLATFORM
An innovative platform from ICOMS ENABLING vehicle data analytics for vehicles, bikes and pedestrians. Data collection can be used to optimise travel times, and reduce both congestion and greenhouse gas emissions.
This web-based analytics platform, works effectively for the TMA-3B3 bicycle sensor, I-SAFE radar speed signs, and TMS-SA non-intrusive vehicle counters and classifiers. The new software platform can also be adapted to collect data from third-party sensors and is designed to support Smart City solutions by enabling data analysis for multiple sensor models. This powerful analytics platform enables customers to collect, manage and analyse vehicle, bike and pedestrian data using with its easy-to-use web-based interface.
Using the new analytics platform, data is uploaded to a server in near real time and may be viewed using a web browser. Alternatively, data from sites may be downloaded in standard spreadsheet formats. This provides traffic managers with an easy way to acquire device data remotely from multiple locations.
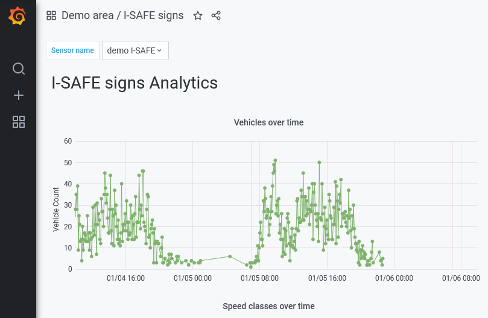
The dashboard views available within the platform offer quick analysis in the form of charts for selected time periods. The traffic reports cover speed, volume and direction. Graphs for the bicycle sensors and radar speed signs include binned speed ranges, while the TMS-SA classifier display includes charts showing the breakdown of traffic by length class.

ICOMS Analystics Dashboard

Data example: I-SAFE – Vehicles over time
ICOMS Analytics Product features:
-
Users can have multiple dashboards to monitor several types of sensor
-
Multiple dashboards also available for the same type of sensor eg. for multi-language use
-
Easy to navigate user interface
-
Data selectable by flexible time-range
-
Data downloadable as CSV file
To order
Contact us today on:
info@ct-technologyinfo.com

