
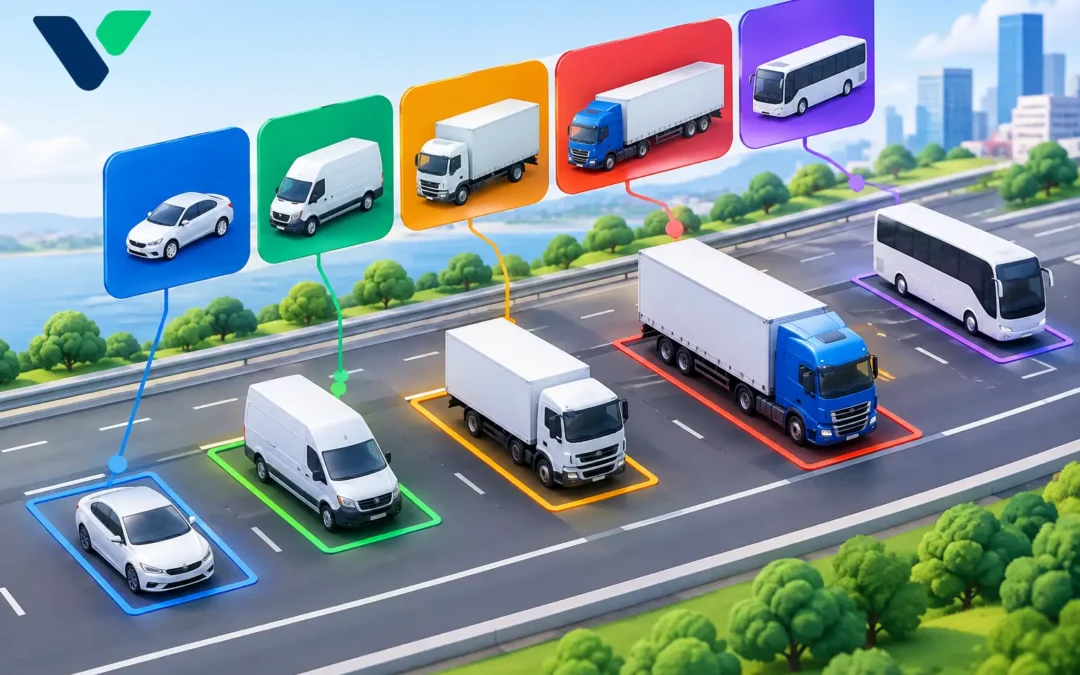
A queue of articulated lorries, delivery vans and private cars may look like a single traffic stream on a dashboard. Operationally, it is not. Each vehicle type occupies road space differently, accelerates and brakes differently, places different demands on a junction, and creates a different safety risk for people walking and cycling. That is why the question, what is vehicle classification, matters well beyond a simple traffic count.
Vehicle classification is the process of detecting, identifying and grouping road users into defined categories. Depending on the scheme and the purpose of the survey, those categories may include bicycles, motorcycles, cars, vans, buses, rigid lorries and articulated lorries. More detailed systems can also distinguish vehicle length, axle configuration, direction of travel and speed.
For highways authorities and traffic engineers, classification turns raw movements into evidence that can guide signal operation, scheme design, enforcement activity, maintenance planning and road safety intervention. The value does not come from assigning a label to every passing vehicle. It comes from using reliable, relevant classes to make better decisions on the network.
What is vehicle classification used for?
A conventional count can establish that 12,000 vehicles use a route each day. Classification establishes whether that figure is dominated by cars, freight movements, buses, or a changing mix across the day. Those differences affect capacity, delay, emissions exposure and the suitability of the road environment.
At a signal-controlled junction, for example, a high proportion of long vehicles may justify a different assessment of clearance times and turning movements than a similar total volume made up mostly of cars. On a rural route, the proportion of heavy goods vehicles can inform speed management, collision investigation and carriageway maintenance priorities. In town centres, separating cycles, powered two-wheelers, buses and general traffic helps authorities understand whether active-travel and public-transport measures are achieving their intended effect.
Classification data is commonly used to support:
- traffic surveys, annual average daily traffic calculations and route monitoring;
- junction modelling, signal design and congestion investigations;
- freight studies, weight-restriction reviews and route management;
- speed analysis by vehicle type, particularly where larger vehicles require separate consideration;
- road safety studies, including vulnerable road user exposure and conflict assessment; and
- before-and-after evaluation of new schemes, restrictions or traffic-calming measures.
The appropriate application determines the level of detail required. A strategic corridor study may only need broad vehicle classes. A scheme evaluating bus priority, cycle use or heavy-vehicle restrictions may need much finer separation and time-of-day reporting.
How vehicle classes are defined
There is no single universal classification structure that suits every road authority, survey specification and detection technology. A classification plan should therefore begin with the operational question, not with the number of categories a sensor can produce.
The simplest approach distinguishes light and heavy vehicles. This can be useful for broad network monitoring but may conceal important differences between a van, a bus and an articulated lorry. More detailed classifications may separate motorcycles, cars, car-derived vans, light goods vehicles, buses, rigid lorries and articulated lorries. Some surveys also use vehicle length bands as a practical proxy where identifying the precise body type is unnecessary.
Vehicle type, size and movement are different measures
These terms are often used together, but they should not be treated as interchangeable. Vehicle type describes what a road user is, such as a bus or bicycle. Size-based classification groups vehicles by physical characteristics such as length, height or axle pattern. Movement data describes how a vehicle travels through the network, including its speed, lane, direction and turning movement.
A radar detector may provide highly dependable speed, direction and length information, making it well suited to many classification and speed-monitoring applications. AI-powered video detection can add object recognition and richer movement context, such as identifying a cyclist in a particular approach lane or tracking a turning movement. The right choice depends on the site geometry, required classes, lighting conditions, privacy requirements, communications and the decisions the data must support.
Why accurate classification changes traffic decisions
Poor classification can create false confidence. If buses are recorded as general traffic, a junction assessment may understate public-transport demand. If vans and cars are combined where freight activity is central to the study, the resulting intervention may address the wrong problem. If bicycles are missed or inconsistently detected, an authority cannot reliably assess cycle demand or exposure at a location where safety improvements are being considered.
Accuracy is particularly important where data is used to justify investment, alter signal timings or evaluate a safety scheme. Decision-makers need to know not only the count but also the detection conditions, class definitions, reporting intervals and any known limitations. A result from a clear, single-lane approach cannot automatically be assumed to perform the same way at a congested multi-lane junction with frequent occlusion.
The most useful systems provide data that can be checked against site conditions and exported in a form that supports analysis over time. A single seven-day survey may identify a concern. Continuous monitoring can reveal whether it is a regular weekday pattern, a school-term effect, a seasonal freight issue or the result of diversionary traffic during works elsewhere on the network.
Non-intrusive detection and classification
Historically, many classification surveys relied on pneumatic tubes or inductive loops installed in the carriageway. These methods can be effective in suitable circumstances, but installation may require lane closures, traffic management, excavation or repeated disruption when equipment needs repair or replacement.
Above-ground detection offers a practical alternative for many applications. Radar sensors can monitor vehicle presence, speed, direction and length without cutting into the road surface. Wireless traffic sensors can support rapid deployment where cabling is difficult. Video analytics can classify multiple road-user types and provide the spatial detail needed to understand lane use, queues and turning movements.
Non-intrusive technology does not remove the need for good engineering. Sensor position, mounting height, detection zone design, line of sight and commissioning all influence data quality. Video systems also require careful consideration of glare, shadows, weather, night-time performance and obscuration by larger vehicles. Radar can be less affected by poor visibility, although it may not provide the same visual context as a camera-based system.
The strongest deployment is usually the one that matches the detector to the task. A high-speed approach requiring dependable speed and length information may favour radar. A complex urban junction where buses, cyclists, pedestrians and vehicle movements need to be separated may benefit from AI video detection. In some locations, combining complementary technologies provides greater operational confidence than relying on a single data source.
Specifying a classification system that delivers useful data
Before selecting equipment, define the decisions the data must support. This should include the required vehicle and road-user classes, expected traffic volumes, approach speeds, lane arrangement, reporting frequency, retention period and whether live outputs are needed for traffic control or only periodic analysis.
It is also worth establishing how performance will be validated. A practical validation plan compares system outputs with observed traffic samples across representative conditions, rather than accepting a generic accuracy claim. Consider peak congestion, darkness, rain, low sun and the presence of closely following vehicles. These are the conditions that often expose the difference between a technically capable detector and a dependable operational installation.
Integration matters as well. Classification data becomes more valuable when it can be viewed alongside counts, speeds, queues, signal status and incident records. A vehicle data management platform can help traffic teams identify trends, compare sites and produce consistent reports without manually reconciling separate datasets.
For C & T Technology, the objective is not simply to replace road-embedded detection. It is to give road authorities practical, above-ground intelligence that can be installed with less disruption and used to improve real operating conditions.
Turning classifications into action
Vehicle classification is most effective when it answers a focused question: Are heavy vehicles using an unsuitable route? Has a new bus gate changed traffic composition on neighbouring streets? Are cycle flows increasing at the times a junction operates most inefficiently? Is a speed issue concentrated among a particular class of vehicle?
Set the question first, specify only the classes needed to answer it, and validate the detection in the conditions that matter at the site. Done well, classification gives engineers a clearer view of who is using the network, not merely how busy it appears. That clarity is the starting point for safer roads, reduced congestion and more sustainable transport decisions.